Discover the key Excel functions for financial modelling.
The top eight Excel Functions financial modellers need to master
I know what you are thinking – eight functions, really Giles, is that it? – I thought financial modelling was supposed to be complicated, surely I need more than eight functions?
And here in lies the secret of the best financial models: they are built using a very small set of very simple functions. In fact when I am modelling I always challenge myself to create the simplest and clearest solution using a very simple set of functions.
OK, so let’s take a look at these magic eight functions.
SUM
Well, you can’t get a lot simpler than the SUM function, but it is the mainstay of all financial models. SUM is used to add up (or sum) all the values in the selected range. In the example below we are summing J14 to BY14:
.png?width=400&name=image%20(8).png)
IF
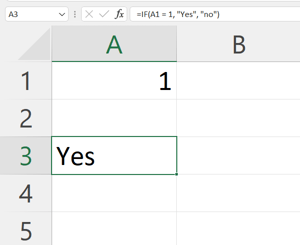
The IF function is one of the most used functions in Excel-based financial modelling and it is therefore a key function to have in your Excel toolkit.
The IF function performs a logical test (that is to say - is something true or false) and then returns the value you have provided if the result is TRUE or the value you have provided if the result is FALSE.
EOMONTH
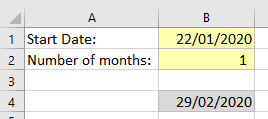
The EOMONTH function returns the date serial number for the last day of the month for the current month plus or minus the number of months you have specified.
In financial modelling the EOMONTH function is often used to switch dates between the start of the month and end of the month and to move from one month to the next.
MAX
The MAX function returns the largest value in the range of numbers provided.
In financial modelling the MAX function is very useful for ensuring that the result of a calculation does not go below a given threshold. It is often used to ensure that a balance does not go below zero for example.

MIN
The MIN function returns the smallest value in the range of numbers provided.
In financial modelling the MIN function is very useful for ensuring that the result of a calculation does not go above a given threshold.
In cashflow forecasting we can use the MIN function to show the lowest closing cash balance.
INDEX
The INDEX function is one of Excel's lookup and reference functions.
In financial modelling we use the INDEX function to return a value from a range based on the position specified. In scenario modelling we can use INDEX to pull the values for the selected scenario.
INDEX is often combined with the MATCH function to to map data from one table into another based on a unique reference.
SUMIFS
The SUMIFS function is one of Excel's maths and trig functions.
The SUMIFS function returns the total value for rows in a dataset that meet the criteria that have been defined.
SUMIFS is an extremely useful function for obtaining the values to use in your reports.
XLOOKUP
In modelling we use the XLOOKUP function to map data from one table into another based on a unique reference.
XLOOKUP is a much improved version of existing lookup methods such as VLOOKUP, HLOOKUP and INDEX MATCH.
The function includes an optional argument of what to return if no match is found. This removes the need for separate error management functions.