
Two new mind-blowing Excel function are on the way
Announced by Microsoft on 14th November 2023
In this latest article in our Future of Excel series, we take a quick look at Excel's new GROUPBY and PIVOTBY functions.
These two new functions are going to fundamentally change the way that we model in Excel. This is a huge development and will be a staple function in a modeller's toolkit going forward.
GROUPBY
The GROUPBY function brings the ability to group, or aggregate, data to Excel using formulae alone.
Let's be honest, this isn't exactly a new concept. In fact the ability to group data has been in Excel since 1993 with the arrival of Pivot Tables and has been part of PowerQuery since its launch in 2010.
This is however the first time that this can be achieved in Excel using just one simple formula.
Here it is in action, grouping the data by category and returning the sales value for each unique category:
[Image courtesy of Microsoft Tech Community]
Note that the GROUPBY function uses Excel's Dynamic array engine to spill the results, with the formula just entered in one cell (G2).
In order to group your data in Excel using the GROUPBY function you will need three core arguments:
- row_fields: What to group rows by (eg Category)
- values: the numbers to aggregate (eg Sales)
- function: the function that you want to apply (eg Sum)
There also further optional arguments that enable both sorting and filtering. Here is the full function syntax for GROUPBY:
GROUPBY(row_fields,values,function,[field_headers],[total_depth],[sort_order],[filter_array])
For more detail on the GROUPBY function visit the Microsoft Tech Community.
PIVOTBY
Here it is in action, grouping the data by category and returning the sales value for each unique category but now also with the year across the columns:

[Image courtesy of Microsoft Tech Community]
In order to group your data in Excel using the GROUPBY function you will need three core arguments:
- row_fields: What to group rows by (eg Category)
- col_fields: What to group columns by (eg Year)
- values: the numbers to aggregate (eg Sales)
- function: the function that you want to apply (eg Sum)
Like GROUPBY there also further optional arguments that enable both sorting and filtering. Here is the full function syntax for PIVOTBY:

PIVOTBY(row_fields,col_fields,values,function,[field_headers],[row_total_depth],[row_sort_order],[col_total_depth],
         [col_sort_order],[filter_array])
For more detail on the PIVOTBY function visit the MICROSOFT TECH COMMUNITY.
Functions
Both the GROUPBY and PIVOTBY functions offer these functions:
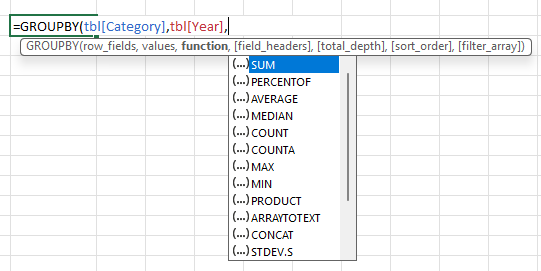
[Image courtesy of Microsoft Tech Community]
My thoughts
Microsoft are really knocking it out of the park at the moment. There just seems to be a constant flow of really useful new features landing in Excel.
GROUPBY and PIVOTBY are likely to fundamentally change the way that we build models in the future. That might sound a bit extreme but there are so many real-life modelling applications for these two new Excel functions.
Could this spell the end of Pivot Tables?.
Release date
The feature is currently available in the Beta channel version of Excel.
Our Future of Excel series
This series of articles focuses on new features recently released or soon to be released in Excel. See the announcement from the MICROSOFT TECH COMMUNITY team.
See other articles in our Future of Excel series here.


