
Quickly understand how a workbook is structured.
Microsoft has unveiled the New Navigation Pane feature in Excel. The Navigation Pane is currently only available in the Beta version of Excel. It is designed to help users quickly understand how a workbook is structured. Also, how to navigate easily between the worksheets and objects in the model.
The Navigation Pane may not sound as ground-breaking as dynamic arrays or the recent Lambda development. I think, however, it’s going to make a real difference to a huge number of Excel users.
At Full Stack, we are excited to see how this new feature will help financial modellers communicate the structure and flow of their models.
So, what is the Navigation Pane in Excel?
The Navigation Pane development is part of Microsoft Excel’s new inclusivity features. The aim is to make Excel more accessible for everyone.
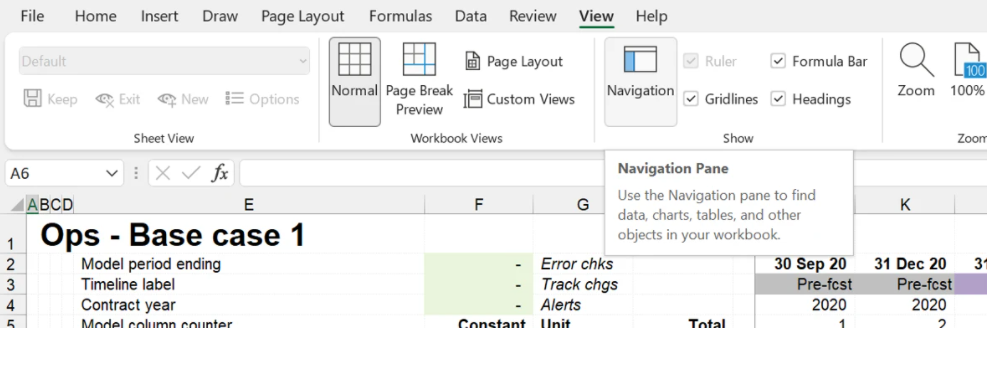
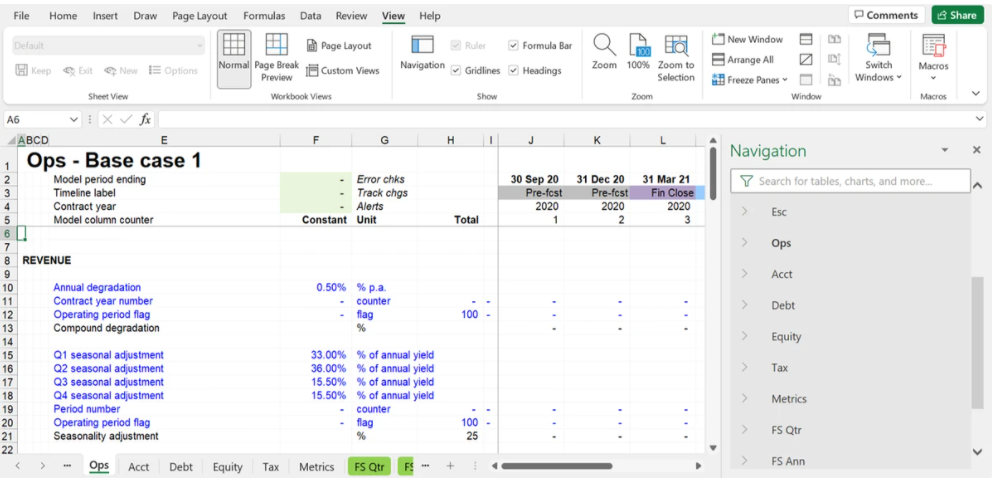
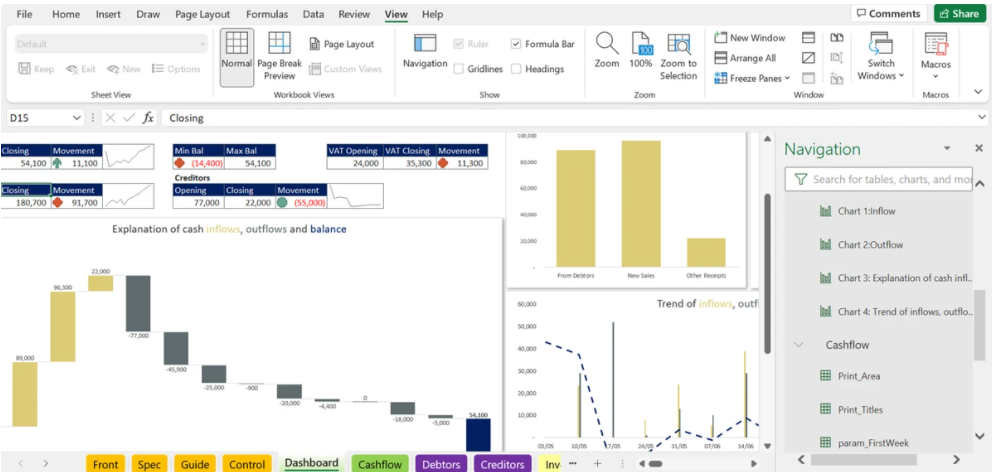
The Navigation Pane is launched from the view tab on the ribbon (Alt > W > K shortcut) (in Beta version only at the time of writing). It lists all of the worksheets in the current workbook in a table of contents style. Expanding a worksheet name lists all of the objects, such as tables, named ranges, images, shapes, charts, and pivot tables in that worksheet.
How can we use the Navigation Pane in Financial Modelling?
In Financial Modelling, transparency and ease of use are absolutely vital. I’m sure you’ve experienced the pain of picking up a model from a colleague and felt your heart drop as you try to unpick the logic and flow. Trawling through the tabs and rows of numbers trying to work out how it hangs together.
A good financial model must be well designed and structured. Always, with the end-user experience in mind. Separation of Inputs, workings, and outputs on clearly named worksheets with tab colouring to clearly communicate purpose is a key element of this.
With an automatically generated table of contents that also lists out the key objects within the model. I think it will really improve model transparency. I can’t wait for it to come to the main version of Excel so we can start putting it into action.


